The 2017 Planning & Progress Study by the Northwestern Mutual Life Insurance Company (NWM) has a press release titled Americans Besieged by Debt: 4 in 10 Spend Up to 50% of Monthly Income on Debt Payments. The inaccuracy and uselessness of this statistic is astonishing, particularly for an in-house press release.

Firstly, the statistic should be 4 in 10 among those who reported having debt. According to NWM’s 2017 Debt Dilemma presentation, they surveyed 2117 U.S. adults, plus an oversample of 632 Millennials, for a total of 2749 respondents. NWM’s slides are inconsistent—Slides 3 and 6 say “those with some debt” constituted 1086 respondents, while Slides 4–5 say 1597 respondents. I think the 1086 figure likely included the 2117 adults, while the 1597 figure likely included the 2749 adults (including the oversample), which would indicate that 511 of 632 oversampled Millennials (80.9%) reported having some debt, compared to 1086 of 2117 from the general sample (51.3%). This seems reasonable, given that Millenials are more likely to have student loan debts.
Even if we include the oversample, 1597 of 2749 respondents is only 58.1%. On Slide 4, NWM says that “more than 4 in 10 Americans with debt (45%) spend up to half of their monthly income on debt repayment.” Therefore, among all Americans, this figure should be .581 × .45 = .261 or 26.1%—only 2.6 in 10 Americans report spending up to half their monthly income on debt payments, not 4 in 10 as NWM incorrectly claims. Confusingly, the question asked respondents to exclude their primary home mortgage, yet includes a “mortgage is my only debt” choice, which 15% selected. Adding to the confusion, on Slide 3 it says the “amount of debt” question excluded mortgages, even though the question prompt is “how much do you estimate your debt to be?” without mentioning mortgages. Who knows what is going on here? Can such a survey even be cited when NWM keeps changing their story and refuses to provide the actual questions or raw data?
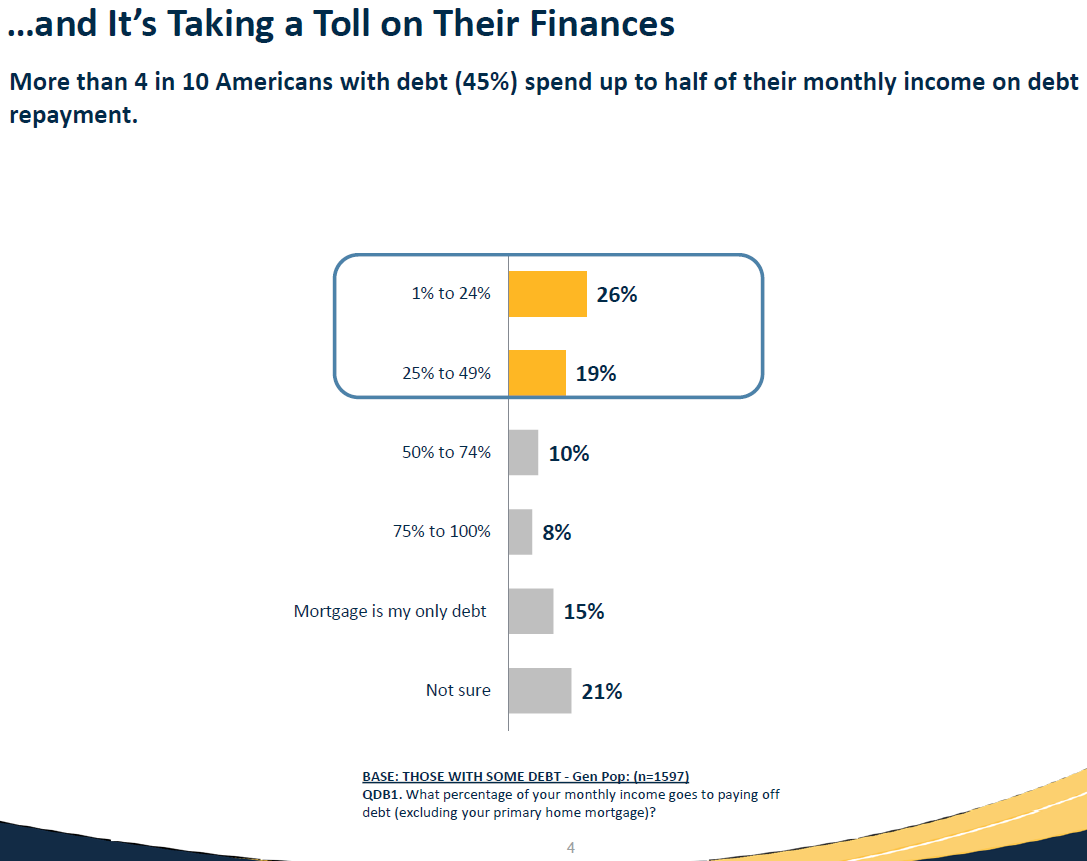
Next, I turn to the elephant in the room—something that is blatantly obvious, at least to me. HOW is “up to half of their monthly income” in ANY way a useful statistic?! This only tells us they do not spend more than half their monthly income on debt payments, which is almost worthless. It would be like saying “4 in 10 Americans consume up to half their calories from donuts,” meaning that they consume anywhere from zero to 50% of their calories from donuts. The NWM statistic does not mean that 55% of Americans with debt spend more than half their monthly income on debt payments (which, if true, would be astonishing and much more meaningful). In fact, in addition to “mortgage is my only debt” (15%), “not sure” (21%) is also an option.
The egregious statistical illiteracy of NWM’s PR department is evident, as is their lack of consultation with whomever at NWM concocted this study, although NWM’s slides are also, at times, bewildering. An interesting and relevant statement would have been “among Americans with debts, 18% reported spending more than half their monthly income on debt payments.” But, “up to half” is sophomoric.
As a general trend, note also that NWM proffers only descriptive statistics rather than inferential statistics. My recent poster presentation, Relationships Between Financial Capability and Education Attainment: An Analysis of Survey Data From the 2015 National Financial Capability Study (NFCS), used inferential statistics to compare knowledge of personal finance with degree attainment. The FINRA Investor Education Foundation is government-funded and is tasked specifically with conducting surveys and statistical analyses, unlike NWM. Nevertheless, FINRA’s 2015 annual report, like NWM’s reports, is devoid of inferential statistics. This is sad. The NFCS provides detailed statistical files, so it’s tempting to argue that such analyses will come out on their own, from unaffiliated researchers. However, too often, this simply does not happen, even though there are many interesting relationships to be examined. In the NWM studies, for instance, running inferential procedures to compare the oversample of Millennials with the general population would empower us to say that Millennials are significantly different along dimensions such as debt burdens, student loans, et cetera, and provide effect sizes to boot. Surprisingly, NWM’s 2017 Planning and Progress Study provided only two reports (the Debt Dilemma and the Financial States of America), unlike past years (e.g., 2016) which had many more reports (eight in 2016), and neither of the 2017 reports include even descriptive statistics on the oversample of Millennials. Why bother collecting the data, then? Well, we know the reason. To market life insurance.
FINRA and NWM should both employ more statisticians, so they can provide insightful and detailed inferential analyses, among other useful statistics. This would greatly increase the value of their surveys to the public and to researchers, including researchers who are capable of performing the analyses but for whom it would only provide tangential value (e.g., supporting evidence for an argument in their manuscript).
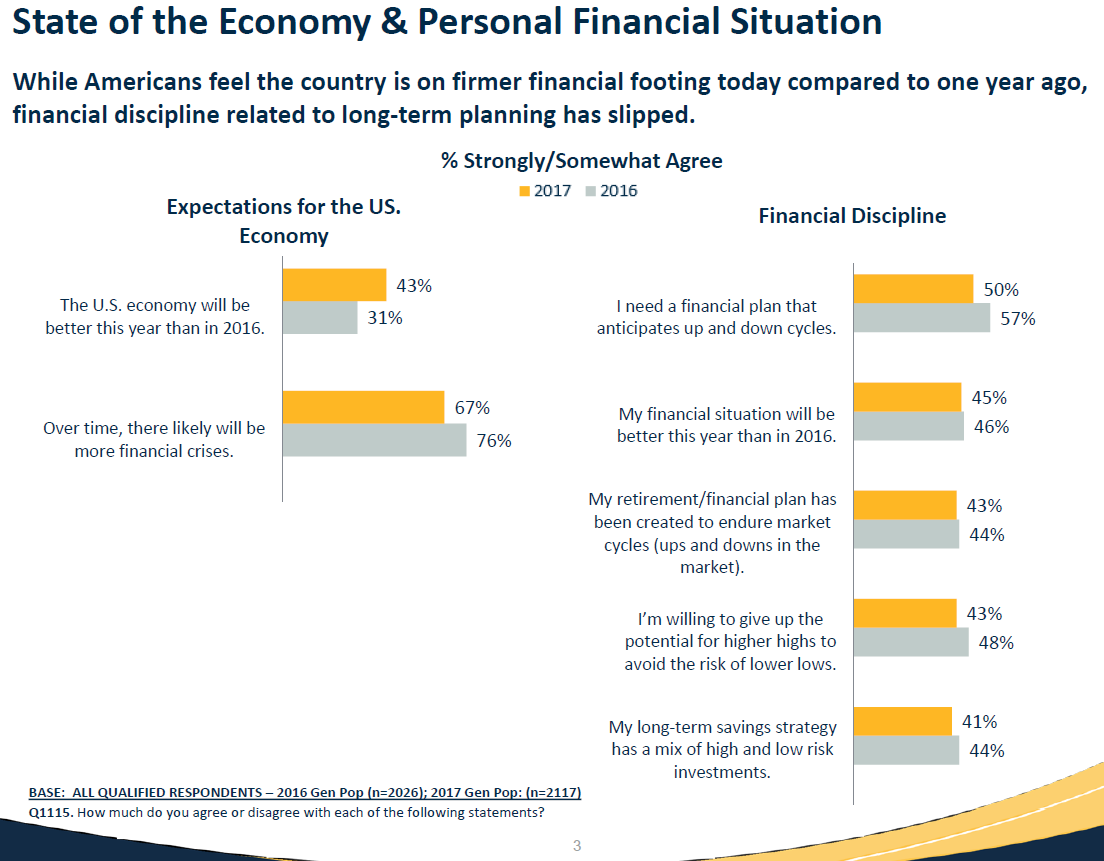
To complete my rebuttal, I should analyze the rest of NWM’s 2017 Planning and Progress data. Their Financial States presentation is brief, and involves only perceptions. Unlike NFCS, there are no questions that actually measure content-knowledge. The usefulness of asking respondents questions such as “my long-term savings strategy has a mix of high and low risk investments” is dubious. This is the same sample of which 21% does not even know how much debt they have. How do we know whether they consider high-risk investments penny stocks and low-risk investments to be their Bank of America 0.03% APY savings account? Their “mix” of high- and low-risk “investments” could be totally stupid. Without explicitly defining our terminology, and ideally being able to correlate responses with questions measuring financial knowledge or competence, it is difficult to draw inferences from attitudinal questions like the preceding, or questions like “the ‘American dream’ is still attainable for most Americans.” How do you define the American dream? Does it involve emitting an ungodly amount of carbon dioxide and destroying the earth? Perhaps “the ‘human existential nightmare’ is still attainable for most Americans” might be a more accurate question.

I found the above figure enlightening. These responses are among the 1086 respondents with “some” debt (evidently excluding the oversample of Millennials; see my discussion earlier). Granted, this question asks “which of the following best describes your strategy for managing your debt,” and much of what is listed are non-strategies. However, the option for “pay all bills monthly/on time” is present, and was selected by only 3% of those with debts. This is horrible. “I pay as much as I can on each of my debts each month” is not a strategy, yet 35% picked it. If you pay as much as you can, how do you know you will even be able to make the minimum payments next month? What do you do for unexpected expenses? Probably payday loans, given the deplorable state of American’s financial expertise. Where is the foresight? “I pay what I can when I can” is equally bad and also a non-strategy—at least 53% of respondents endorsed non-strategies. On the other hand, while not ideal, making minimum payments each month, or focusing on high-interest debts while making at least the minimum payments on others, are strategies. Doing so protects your credit from delinquency and allows you to avail of technical tricks like credit card balance transfers (BT) to mitigate high-interest debts. You can’t get a BT offer on a new credit card if you can’t get approved because of late payments or collections on your credit report.
In conclusion, while I agree with NWM’s conclusion that Americans are a financial basket case, their methodology is idiotic and their claims are blatant statistical misrepresentations. To cap it off, NWM’s infographic below claims that Americans spend 40% of their monthly income on leisure… without mentioning that the question asked respondents to exclude spending on “basic necessities” including housing, food, and transportation! Clearly, NWM is more interested in giving bombastic, just-plain-wrong talking points to the media, rather than an accurate representation of their survey data, which actually is not even in need of embellishment.
